

 Our Editorial Team






Precious Metal Spot Prices Today: Gold, Silver, Platinum & Palladium (March 2026)
Gold trades at $2,890/oz, silver at $32.40/oz, platinum at $1,020/oz, and palladium at $1,150/oz as of the March 21, 2026 LBMA morning fix. All four metals are up year-over-year, driven by sustained central bank purchasing (1,037 tonnes in 2023, 982 tonnes in 2024 per World Gold Council data) and expectations that the Federal Reserve will maintain its 4.75% target rate through Q2 2026.
Current Spot Price Summary (Per Troy Ounce)
- Gold (XAU): $2,890 — up 12% YTD, 52-week range $2,480–$2,950.
- Silver (XAG): $32.40 — up 8% YTD, 52-week range $26.80–$34.20.
- Platinum (XPT): $1,020 — up 6% YTD, 3-year high driven by slower EV adoption preserving hybrid catalyst demand.
- Palladium (XPD): $1,150 — down 34% from 2022 peak of $3,380 as Russian supply sanctions partially lifted.
- Gold/Silver Ratio: 89:1 — above the 40-year average of 68:1, historically signaling silver is undervalued relative to gold.
- Data sources: LBMA AM Fix, COMEX settlement prices, World Gold Council, USGS Mineral Commodity Summaries 2025.
What Drives Precious Metal Prices: The 4 Core Indicators
COMEX futures volume, the LBMA gold price fix, CFTC Commitment of Traders (COT) net positioning, and the DXY dollar index collectively explain more than 80% of short-term precious metal price movements. When DXY falls 1%, gold historically gains 0.8–1.2% (World Gold Council regression analysis, 2000–2025).
Price Driver Breakdown
- COMEX Futures Volume: High volume with rising prices confirms bullish momentum; declining volume signals potential reversals.
- LBMA Benchmark Fix: The twice-daily London fix sets global reference prices for physical gold and silver transactions.
- CFTC COT Reports: Net speculative long positions above 250,000 contracts historically signal overbought conditions within 4–6 weeks.
- DXY Dollar Index: Inverse correlation with gold — a weakening dollar makes dollar-denominated metals cheaper for foreign buyers.
- Real Yields (10-Year TIPS): Negative real yields make non-yielding gold more attractive; positive real yields above 2% create headwinds.
- Central Bank Purchasing: Emerging market central banks (China, India, Turkey, Poland) diversifying away from USD reserves into physical gold.
Gold Price Analysis: Current Levels, Key Drivers & 2026 Forecast
Gold gained 25.1% in 2022 as US CPI peaked at 9.1% (BLS data), outperforming the S&P 500 which fell 18.1%. Since then, gold has maintained an upward trajectory as central banks purchased a record 1,037 tonnes in 2023 and 982 tonnes in 2024 (World Gold Council). During the 2022–2023 inflation surge, retail investors drove gold ETF inflows to $47 billion, while Chinese and Indian jewelry buyers absorbed 2,180 tonnes annually, establishing a demand floor that prevented gold from falling below $1,750/oz.
Gold Demand Categories & Current Data
- Investment demand (ETFs, bars, coins, allocated accounts): 25% of annual consumption, heavily influenced by real yield levels.
- Central bank reserves: Official sector purchasing at 55-year highs — diversification away from dollar-denominated assets accelerating.
- Jewelry fabrication: 2,180 tonnes/year baseline demand led by China (700t) and India (650t).
- Technology applications: Electronics, dentistry, aerospace — approximately 330 tonnes annually.
- Mine supply: Annual production approximately 3,500 metric tonnes, with discovery rates declining since 2012.
- Premium over spot for physical bullion: 3–8% for bars, 12–25% for coins depending on dealer, mint, and current demand.
Analyst consensus for Q2–Q3 2026 projects gold in a $2,750–$3,100 range, with the upper bound contingent on a Fed rate cut cycle beginning in Q3. The key risk to the downside is a surprise inflation reacceleration that forces the Fed to hike, pushing real yields above 2.5% and strengthening the dollar — both historically bearish for gold.
Silver Price Dynamics: Industrial Demand vs. Investment Demand
Silver functions simultaneously as a monetary hedge (price correlates 0.82 with gold over 20 years) and an industrial input that solar manufacturers, EV producers, and electronics firms compete to secure — a dual demand structure that amplifies price volatility to 2.3 times gold's. Industrial buyers consume 65% of annual silver supply — solar manufacturers, EV producers, and electronics firms collectively absorbed over 200 million ounces in 2025 alone (Silver Institute World Silver Survey) — while investors absorb the remaining 35%, creating a dual demand structure that amplifies price volatility to 2.3 times gold's.
Silver Market Fundamentals & Supply Deficit
- Solar panel manufacturing: 200+ million oz/year and growing 15% annually as global solar capacity expands.
- Electronics & EV applications: Smartphones, 5G infrastructure, electric vehicle contacts — 150 million oz/year.
- Investment demand: Coins, bars, and SLV ETF holdings — 350 million oz, fluctuating with risk sentiment.
- Supply deficit: Mine production (820M oz) plus recycling (180M oz) falls short of total demand (1.1B oz) for the third consecutive year.
- Gold/silver ratio at 89:1 signals historic undervaluation — ratio has averaged 68:1 over 40 years, with sub-50 readings during silver bull markets.
- Bid-ask spread on physical silver: 5–15% for coins, 2–5% for 100oz bars — wider than gold due to smaller market size.
Platinum & Palladium Prices: Automotive Demand Cycles & Supply Risk
Platinum rallied 22% to a 3-year high of $1,080/oz in January 2026 as automakers extended hybrid catalyst production and hybrid demand proved more resilient than EV-only forecasts assumed. Palladium shed 66% from its 2022 peak of $3,380 after Russian Norilsk Nickel resumed exports and automakers substituted platinum in catalytic converters. South Africa produces 70% of global platinum supply and Russia produces 40% of palladium supply, concentrating production risk — a single mine disruption can move prices 5–12% within a week (USGS Mineral Commodity Summaries, 2025).
PGM Market Analysis
- Platinum: $1,020/oz, trading at a $1,870 discount to gold — a historically wide gap that some analysts view as a buying opportunity.
- Palladium: $1,150/oz, down from $3,380 peak — supply normalization from Russia has removed the scarcity premium.
- Diesel catalysts use platinum; gasoline catalysts use palladium — the ICE-to-EV transition timeline directly impacts demand.
- Hydrogen fuel cells require 30–60g of platinum per unit — a potential new demand driver as hydrogen infrastructure expands.
- Substitution flexibility: Automakers can switch between platinum and palladium in catalysts when price differentials exceed $500/oz.
- South African supply risk: Eskom power grid instability causes rolling blackouts at mines, creating periodic supply disruptions.
Gold/Silver Ratio: What It Tells Investors Right Now
The gold/silver ratio at 89:1 (March 2026) sits above the 40-year average of 68:1, historically signaling that silver is undervalued relative to gold. When this ratio exceeded 80:1 in March 2020, silver subsequently outperformed gold by 47% over the following 12 months. Conversely, when the ratio fell below 50:1 in early 2011, gold outperformed silver over the next 2 years.
Historical Ratio Context
- Current ratio: 89:1 — one ounce of gold buys 89 ounces of silver.
- 40-year average: 68:1 — current level is 31% above the historical mean.
- 2020 extreme: Ratio hit 125:1 in March 2020 (COVID panic) before reverting to 65:1 by February 2021.
- 2011 low: Ratio touched 32:1 during the silver squeeze, then expanded to 85:1 by 2019.
- Contango vs. backwardation: Silver futures curve in contango (2.1% annualized) suggests adequate near-term supply.
- Trading implication: At 89:1, historical probability favors silver outperformance over 12–24 months — but position sizing should reflect silver's 2.3x greater volatility.
How to Invest in Precious Metals: Physical Bullion vs. ETF vs. Gold IRA
Investors access precious metals through five vehicles, each with distinct cost structures, liquidity profiles, and tax treatments: (1) physical bullion — American Eagle, Canadian Maple Leaf, and Krugerrand coins or LBMA Good Delivery bars of .9999 fineness; (2) grantor-trust ETFs (GLD, IAU, SLV, PPLT, PALL); (3) closed-end funds like Sprott Physical Gold Trust (PHYS) and Sprott Physical Silver Trust (PSLV), which qualify for standard 15–20% long-term capital gains via QEF election; (4) mining equity ETFs (GDX senior miners, GDXJ juniors) and streaming/royalty companies such as Franco-Nevada and Wheaton Precious Metals, taxed at standard 15–20% LTCG; and (5) self-directed Gold IRAs holding IRS-approved bullion in segregated storage at Delaware Depository or Brinks. Physical metal and grantor-trust ETFs are taxed as collectibles at a 28% long-term capital gains rate under IRC §408(m)(3) in taxable accounts.
Investment Vehicle Comparison
- Physical bullion: American Eagle, Canadian Maple Leaf, and Krugerrand coins (12–25% premium over spot) or LBMA Good Delivery bars (.9999 fineness, 0.5–1.5% storage). Each bar carries an assay certificate and hallmark verifying purity. Numismatic coins carry higher premiums but no IRA eligibility unless they meet IRS purity requirements.
- ETFs: GLD (expense ratio 0.40%), IAU (0.25%), SLV (0.50%), PPLT (0.60%), PALL (0.65%). Grantor-trust ETFs taxed as collectibles (28% max rate). Alternative: Sprott Physical Gold Trust (PHYS, 0.41%) and Sprott Physical Silver Trust (PSLV, 0.62%) — closed-end funds (CEFs) eligible for 15–20% LTCG via QEF election.
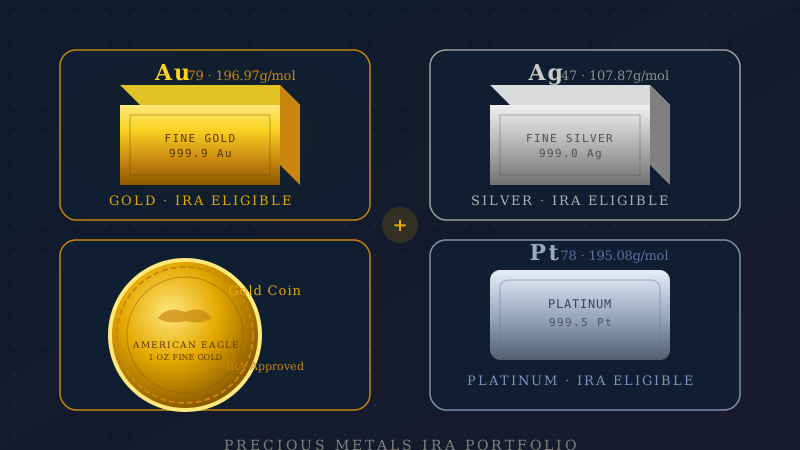
- Gold IRA: Self-directed IRA with IRS-approved custodian. Setup fee $50–$150, annual custodian fee $75–$300, segregated storage fee $100–$300 at Delaware Depository or Brinks. Minimum investment $10,000–$50,000. Tax-deferred growth (Traditional) or tax-free (Roth). IRS purity requirements: gold 99.5%, silver 99.9%, platinum/palladium 99.95% per IRC §408(m)(3).
- Allocated vs. unallocated accounts: Allocated accounts hold specific bars/coins in your name — unallocated accounts are cheaper but represent a claim on pooled metal.
- Mining equities: GDX (senior miners, 0.51% expense ratio) and GDXJ (junior miners, 0.52%) offer leveraged exposure to metal prices. Streaming/royalty companies like Franco-Nevada and Wheaton Precious Metals provide downside protection vs. direct miners. All mining equities receive standard 15–20% LTCG treatment in taxable accounts.
- Futures contracts: Leverage of 10:1 to 20:1 allows capital-efficient exposure but carries margin call risk. Contango erodes returns on rolled positions.
- Dollar cost averaging: Monthly purchases of $500–$2,000 reduce timing risk — historically effective for accumulating physical metals over 3–5 year horizons.
Top Gold IRA Companies 2026: Fees, Minimums & Rankings
Augusta Precious Metals ranks #1 for 2026 based on fee transparency (no hidden charges), BBB A+ rating with zero complaints in 3 years, and a $50,000 minimum suitable for investors rolling over existing 401(k) or IRA accounts. Rankings are based on independent editorial analysis of published fee schedules, BBB complaint data, verified customer reviews, and regulatory compliance — not advertiser compensation. IRA rollover rules are governed by IRS Publications 590-A (contributions) and 590-B (distributions).
Key Selection Criteria
- Fee transparency: Compare setup fees, annual custodian fees, storage fees, and any hidden transaction markups.
- BBB rating and complaint history: A+ rating with fewer than 5 complaints in 3 years indicates reliable service.
- Buyback guarantee: Companies that buy back metals at or near spot price reduce liquidation risk.
- IRS-approved storage: Delaware Depository and Brinks are the most commonly used IRS-compliant facilities.
- Custodian partnerships: Equity Trust, GoldStar Trust, and New Direction Trust are leading self-directed IRA custodians.
- Rollover process: Most 401(k)-to-Gold-IRA rollovers complete in 2–4 weeks with no tax penalties when done as trustee-to-trustee transfer.
Are Precious Metals a Good Investment? Pros, Cons & 2026 Data
Precious metals are a good investment for portfolio diversification and inflation hedging, but not as a primary growth vehicle. Gold gained 25.1% in 2022 when the S&P 500 fell 18.1%, demonstrating its crisis-hedge value. Over the 10-year period 2016-2026, gold returned approximately 137% while the S&P 500 returned over 178% (price return). World Gold Council research shows a 5-10% precious metals allocation reduces overall portfolio volatility without materially reducing long-term returns.
Pros of Investing in Precious Metals
- Inflation hedge: Gold gained 25.1% in 2022 when CPI hit 9.1% (BLS data) — strongest purchasing power protection in a decade.
- Portfolio diversification: Gold's 20-year correlation with the S&P 500 is approximately -0.05, providing genuine non-correlated diversification that reduces portfolio volatility.
- Crisis hedge: Gold rose 24.3% in 2020 (COVID-19), 8.9% in 2008-2009 (while stocks fell 37%), and 36.2% in 2002 (dot-com bust).
- Tangible asset: Physical bullion carries no counterparty risk — unlike bonds or cash, it cannot default, be diluted, or become worthless through institutional failure.
- Central bank demand floor: Official sector buying at 55-year highs (982 tonnes in 2024, World Gold Council) limits structural downside.
- Currency hedge: In countries with currency crises (Argentina, Turkey, Egypt), local gold prices surged 200-400%, preserving purchasing power.
Cons of Investing in Precious Metals
- No income: Gold, silver, and platinum produce zero dividends or interest. Total return equals price appreciation only.
- Storage costs: Physical metals require secure storage ($100-$500/year), reducing net returns. Gold IRAs add custodian fees ($75-$300/year).
- Long-term underperformance vs. equities: In the 2010-2020 bull market, gold returned 26% while the S&P 500 returned 254%.
- Volatility in silver and PGMs: Silver is 2.3x more volatile than gold; palladium crashed 66% from its 2022 peak.
- No business value creation: Unlike stocks, metals do not benefit from productivity growth, innovation, or earnings expansion.
- Transaction costs: Physical bullion bid-ask spreads of 3-25%, plus storage and insurance, require significant price gains just to break even.
$1,000 Invested in Gold 10 Years Ago: What Would It Be Worth Today?
A $1,000 investment in gold in April 2016 (when gold traded at approximately $1,220/oz) would be worth approximately $2,369 in March 2026 — a 137% gain over 10 years. The same $1,000 in the S&P 500 with dividends reinvested would be worth approximately $3,780 (278% return). However, gold's path was significantly smoother: its maximum drawdown was -20.2% versus -33.9% for the S&P 500 in COVID and -25.4% in the 2022 correction. Gold's risk-adjusted returns are more competitive than nominal figures suggest.
10-Year Performance Comparison (April 2016 to March 2026)
- Gold (XAU): $1,220/oz to $2,890/oz. Return: +137%. $1,000 became $2,369. Max drawdown: -20.2%.
- Silver (XAG): $15.80/oz to $32.40/oz. Return: +105%. $1,000 became $2,051. Max drawdown: -53% (March 2020).
- Platinum (XPT): $980/oz to $1,020/oz. Return: +4%. Significant underperformance due to EV fears and diesel scandal.
- Palladium (XPD): $565/oz to $1,150/oz. Return: +104%. But peaked at $3,380 in 2022, then crashed 66%.
- S&P 500 (total return including dividends): +278%. $1,000 became approximately $3,780.
- Key lesson: Gold's value is crisis protection and inflation hedging. In 2022: gold +0.4%, S&P 500 -18.1%. In 2020: gold +24.3%, S&P 500 +18.3% (but with extreme March volatility).
World Gold Council portfolio optimization research shows that a 10% gold allocation within a diversified equity/bond portfolio improves the Sharpe ratio (risk-adjusted return) in most historical scenarios by reducing maximum drawdown with only modest reduction in total return.
Best Precious Metal to Invest in Right Now: 2026 Rankings
Based on March 2026 fundamentals, gold ranks #1 for capital preservation, silver offers the highest risk-adjusted upside potential, platinum represents a deep-value opportunity, and palladium remains challenged by structural oversupply. Rankings reflect current valuation versus historical norms, near-term demand fundamentals, supply concentration risk, and investment vehicle availability.
2026 Investment Rankings by Metal
- #1 Gold ($2,890/oz) — Best for capital preservation and IRAs. Central bank buying at 55-year highs creates structural demand floor. Fed rate policy neutral. Risk: real yields above 2.5% or DXY breakout above 108 would be bearish.
- #2 Silver ($32.40/oz) — Best for higher risk/reward. Gold/silver ratio at 89:1 vs. 68:1 historical average signals undervaluation. Solar manufacturing consuming 200+ million oz/year. Risk: 2.3x gold volatility; industrial recession cuts 65% of demand.
- #3 Platinum ($1,020/oz) — Best for contrarian value investors. $1,870 discount to gold near historic widest. Hydrogen fuel cell adoption is emerging demand catalyst. Risk: South Africa supply concentration (70%), dependent on ICE vehicle longevity.
- #4 Palladium ($1,150/oz) — Best for short-term tactical traders. Down 66% from peak. Russian supply normalization eliminated scarcity premium. Not recommended for IRA investors.
- Portfolio recommendation for $50,000 allocation: 70% gold ($35,000) + 25% silver ($12,500) + 5% platinum ($2,500) — diversifying across market cycles with gold as stable core.
- For IRA investors: All four metals meet IRS purity requirements (gold 99.5%, silver 99.9%, platinum/palladium 99.95%). Most top-ranked custodians specialize in gold and silver.
What Is the King of All Metals? Gold's 6,000-Year Monetary Dominance
Gold is universally called the king of metals because it is the only common metal that does not tarnish, corrode, or oxidize under normal conditions, it has served as money and a store of value for 6,000+ years across every civilization that recorded economic activity, and its global market capitalization exceeds $16 trillion — more than all other precious metals combined. Gold is also the only non-industrial commodity held in official reserves by 173 of 197 countries worldwide.
Why Gold Holds the King of Metals Title
- Chemical uniqueness: Gold (Au, atomic number 79) is one of very few metals that does not oxidize or tarnish under normal conditions — the property that made it ideal for coinage across all ancient civilizations.
- 6,000-year monetary history: Gold coins were first minted around 600 BC in Lydia (modern Turkey). Every major monetary system until 1971 was anchored to gold through the gold standard.
- Central bank reserve status: 173 countries hold gold in official reserves. The U.S. holds 8,133 tonnes ($756 billion at current prices); Germany 3,352 tonnes; Italy 2,451 tonnes.
- Market capitalization dominance: Gold's $16.2 trillion market cap dwarfs silver ($1.1 trillion), platinum ($245 billion), and palladium ($47 billion) — larger than all others combined.
- Cultural universality: Every major world religion and civilization valued gold — Egyptian pharaohs, Aztec emperors, Roman senators, and modern central banks all recognized it as the supreme store of value.
- Other contenders: Silver is the people's metal (affordable, industrial). Platinum was called white gold by Spanish explorers. Iridium and osmium are rarest by abundance. But none challenge gold's 6,000-year monetary consensus.
Precious Metals Investing for Beginners: Step-by-Step 2026 Guide
New to precious metals investing? Start with five principles: invest only 5-10% of your total portfolio in metals (World Gold Council recommendation), begin with gold before diversifying into silver, choose your investment vehicle based on your time horizon, compare at least three dealers or custodians before committing, and understand all costs including storage and custodian fees before purchasing.
5 Steps to Start Investing in Precious Metals
- Step 1 — Set your allocation: Financial advisors recommend 5-10% of a diversified portfolio in precious metals. On a $100,000 portfolio, that is $5,000-$10,000. Metals are a hedge, not a primary growth engine — do not over-allocate.
- Step 2 — Choose your metal: Start with gold (most liquid, lowest volatility, deepest institutional support, best for IRAs). Add silver once you hold gold. Platinum and palladium suit experienced investors comfortable with higher volatility.
- Step 3 — Select your vehicle: Physical bullion for direct ownership (requires storage at $100-$500/year). GLD/SLV ETFs for low-cost liquidity (expense ratios 0.40-0.50%). Gold IRA for tax-deferred retirement growth (requires IRS-approved custodian).
- Step 4 — Compare dealers and custodians: Target premiums under 5% over spot for bars and under 15% for coins. For Gold IRAs, compare setup fees ($50-$150), annual custodian fees ($75-$300), and storage fees ($100-$300) from at least 3 companies.
- Step 5 — Dollar cost average: Invest a fixed monthly amount ($200-$500) rather than a lump sum. DCA reduces timing risk and builds position gradually across market cycles.
- Beginner mistakes to avoid: Over-allocating beyond 15% of portfolio, buying numismatic (collectible) coins at 50-200% premiums above spot, paying more than 5% over spot for bars, and not verifying IRA custodian is IRS-approved before rolling over funds.